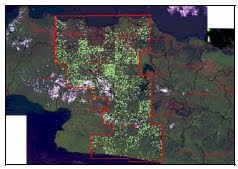
Map and street Trans JOgja

Map Trans JOgja


 Trans Jogja is one of the alternative public transport which is very popular among maysrakat Jogja. For students who have long or just stay in Jogja is quite affordable mode of transportation for students pocket. With the price of a single fare ticket Rp.3000 Transjogja offering cheap transportation convenience with no record of all the places we are close to the boarding Transjogja stop. Please check or donwload any path through the area where you live
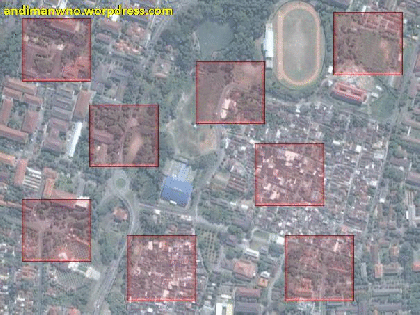
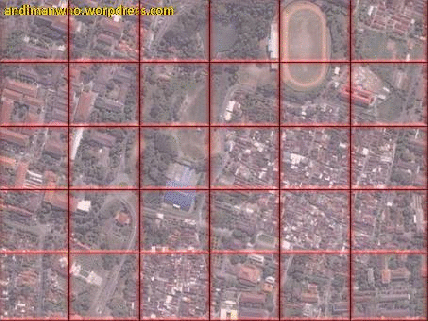
Line 1 A Prambanan Airport Adisutjipto Jackie Flyover Ambarrukmo Plaza UIN Sunan Kalijaga Saphir Square Cinema XXI, Jl. Solo Bethesda Hospital, Scholastic Book Store, Hotel Novotel Hotel Santika, Pizza Hut Webcam Office of the People's Sovereignty Jogjakarta Tugu Station Jalan Malioboro (there are 3 pieces stops) Post Office, the Palace, North Square, Monument March 1, Vredeburg Taman Pintar, State Bank parking Indonesia, Market Beringhardjo, Gondomanan Market Sentul (Jl. State Students) Parks Eating Heroes Kusumanegara Hall Jogjakarta Excited Loka Zoo Jogja Expo Center Jackie Bridges (back toward Kalasan, Adisutjipto Airport to Terminal Prambanan)  Trans Jogja Line 1B Terminal Prambanan Kalasan Adisucipto Airport Maguwoharjo Jackie (passed down) Block O JEC Babadan Gedongkuning Excited Loka SGM Sentul market Gondomanan Post Office RS.PKU Muhammadiyah Flower Market Badran Roundabout SAMSAT Pingit Monument Scholastic UGM roundabout Colombo Demangan UIN Sunan Kalijaga Jackie Maguwoharjo Bandra Adisucipto Kalasan Terminal Prambanan. Trans Jogja Line 2A Terminal Mount Wilson Monjali Monument Tugu Station Malioboro Post Office Gondomanan Jokteng Wetan Tungkak Gambiran Basen Rejowinangun Babadan Gedongkuning Excited Loka SGM Sandalwood Mandala Krida Gayam Flyover Lempuyangan Kridosono Ambassador Discourse Galeria Scholastic UGM roundabout Colombo Terminal Condongcatur Kentungan Monjali Terminal Mount Wilson Trans Jogja Line 2B Terminal Mount Wilson Monjali Kentungan Lean Terminal Chess Colombo UGM roundabout Scholastic Kridosono Ambassador Discourse Fly-over Lempuyangan Gayam Mandala Krida Sandalwood SGM Gembiraloka Babadan Gedongkuning Rejowinangun Basen Tungkak Joktengwetan Gondomanan Post Office PKU Muhammadiyah Hospital Ngabean Wirobrajan CPC Badran Roundabout SAMSAT Pingit Monument Monjali Terminal Mount Wilson. Trans Jogja 3A Line Terminal Giwangan Tegalgendu HS-Silver Jl. Nyi Pembayun Pawnshop Kotagede Basen Rejowinangun Babadan Gedongkuning JEC Block O Jackie (pass on) Jackie Maguwoharjo Adisucipto Airport Maguwoharjo North Ringroad Terminal Condongcatur Kentungan MM UGM MirotaKampus Gondolayu Monument Pingit Roundabout SAMSAT Badran PasarKembang TUGU Station Malioboro Post Office PKU Muhammadiyah Hospital Ngabean Jokteng Kulon Ivory Plengkung Jokteng Wetan Tungkak Wirosaban Tegalgendu Terminal Giwangan.   Trans Jogja Line 3B Terminal Giwangan Tegalgendu Wirosaban Tungkak Jokteng Wetan Ivory Plengkung JoktengKulon Ngabean PKU Muhammadiyah Hospital Flower Market Badran Roundabout SAMSAT Pingit Monument Gondolayu Mirota Campus MM UGM Kentungan Lean Terminal Chess North Ringroad Maguwoharjo Adisucipto Airport Maguwoharjo Jackie (passed down) Block O JEC Babadan Gedongkuning Rejowinangun S3. Basen Pawnshop Kotagede Jl.Nyi Pembayun HS-Silver Tegalgendu Terminal Giwangan. Trans Jogja Line 4A Terminal Giwangan SMK Muhammadiyah 3 Biology Museum Hayam Wuruk SMPN 5 Puro Pakualaman Student Park Ahmad Dahlan University Terminal Giwangan. Trans Jogja Line 4B Terminal Giwangan SMK Muhammadiyah 3 Kusumanegara 3 SGM STPMD 1 UIN Sunan Kalijaga 1 Women Building LPP Sudirman 1 SMPN 5 AA YKPN De Britto UIN Sunan Kalijaga 2 STPMD 2 SMKN 5 Kusumanegara 4 Art Market Ahmad Dahlan University Terminal Giwangan

Assessment Method of Image Interpretation

Method of Assessment: A way of applying in the review or investigation of the object in the image. Image interpretation activities follow a particular method are: Observations from the general to the specific objects objects Observations from the known object to the unknown object. Assessment methods in image interpretation activities generally using 2 different methods, among others: 1. Fishing Expedition Assessment methods objects in the image by means of observations throughout the region and is accompanied by a data retrieval. This activity is similar to the people who fished, explored the waters around the area to look for the presence or absence of fish. So the method is then called with the "Fishing Expedition" or "Fishing Expedition" Fishing Expedition 2. logical Search In this method of observation of the entire region in image retrieval is only performed but is selective in certain areas in accordance with the purpose of interpretation.

Logical Search

ELEMENTS OF IMAGE INTERPRETATION

In image interpretation activities, there are some elements that are used as guidelines in the detection, identification to identify an object. These elements when arranged in a hierarchy according to the level of difficulty of interpretation will look like in the picture below:
Hirarki Interpretasi Citra


I. IMAGE INTERPRETATION
Image interpretation is an activity of assessing, reviewing, identifying and recognizing objects in images, then assess the significance of the object. In image interpretation, there are two main activities, namely object recognition and utilization of information. The steps are usually done to acquire remote sensing data is detect and analyze objects in the images to be useful for a variety of images.
Object recognition is an important part of image interpretation. The principle of object recognition in images based on the investigation of the characteristics of the objects contained in the image. Various characteristics to recognize objects in images is called image interpretation elements, as follows:
Hue and color
Rona is the degree of darkness or brightness levels in the image of the object, while the color of the form is visible to the eye by using a narrow spectrum, narrower than the visible spectrum.

form                 Is a qualitative variable that provides the framework configuration or an object. We can be the object of a football stadium on the aerial photo of the rectangular shape. so we can recognize the shape of the volcano are convex. Schoolgirl shaped I, L, U, or box. Size Size is an object which, among other characteristics such as distance, area, slope height and volume. Size of the object in the image such as scale, therefore the use of size as image interpretation, should always keep in mind the scale .. Sample: Field sports football is characterized by the shape (rectangular) and a fixed size, which is about (80 m - 100 m). Texture is the frequency change of hue in the image. There are also those who say that the texture is repetition in hue group of objects that are too small to be distinguished individually. Texture is given by: coarse, fine, and medium. For example: Forests coarse textured, medium textured shrubs and bushes finely textured. Pattern Pattern or spatial arrangement is a characteristic that marks the many objects and human formation for some natural objects. Example: The pattern of the flow of the river marks the geological structure. Trelis flow patterns mark structural folds. Transmigration settlements identified with a regular pattern, the size of the home and away uniforms, and always facing the street. Rubber, palm oil, coffee plantations are easily distinguished from the forest or other vegetation with a regular pattern, namely the cropping pattern and spacing. Shadow Shadow detail is hidden or objects are in the dark. Nonetheless, the shadows can also be an introduction to the key importance to some objects precisely with the shadows become clearer. Example: steep slopes are more obvious in the presence of shadows, as well as chimneys and towers, appear more clearly in the presence of shadows. The site was the location of an object on other objects in the vicinity. For example, settlements are generally elongated in the coastal shelf edge, or natural levee along the way. Also rice, are common in the lowlands, and so on. Association Association is a relationship between objects with one object lainnya.Contoh: Train station in association with the railroad of more than one (branching), the airport associated with an airport.

IMAGE INTERPRETATION

is interpreting activities, assess, identify, and recognize objects in images, selanjutya assess the significance of the object Activities to obtain data inderja of image interpretation was performed by using the tools, yaiatu stereoscope. This tool serves to display 3D images from two 2D aerial photographs were placed bertampalan. Two aerial photographs is the same but different shooting angles.
Stereoskop - Alat yang digunakan untuk melakukan kegiatan Interpretasi Citra 
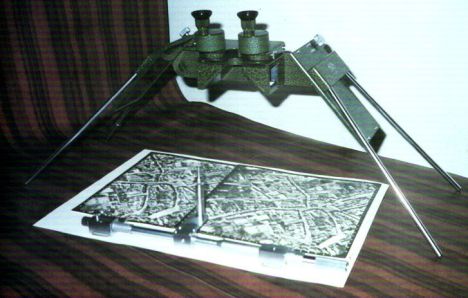
used to conduct Image Interpretation General steps taken to acquire remote sensing data that can be utilized by a variety of fields are: 1. detection At this stage object detection activities recorded on aerial photographs and satellite images 2. identification Mengidentifikai object by its characteristic spectral, spatial and temporal. 3. introduction Object recognition is done in order to classify the object shown in the image based on specific knowledge 4. analysis The analysis aims to group objects that have the same characteristics 5. deduction An object based image processing activities contained in the image to a more specific. 6. classification Includes descriptions and restrictions (delineation) of the objects contained in the image 7. idealization Presentation of the results of image interpretation of data in the form of a ready-made maps.

National Seminar on Nuclear Technology VIII HR 2012

College of Nuclear Technology-BATAN invite you to the researchers, academics, commentators, students to participate in the National Seminar on Nuclear Technology VIII HR 2012. theme Preparation of HR Technology Environmental and Nuclear Safety Cultured Plans Time and Place All activities will take place for one day, Wednesday, October 31, 2012, 8:00 to 17:00 pm, in Meeting Rooms 2 & 3 Floor, PTAPB-BATAN, Jl. Babarsari, Yogyakarta. Important Dates 24 September 2012 postponed to October 8, 2012: Deadline for paper collection October 24, 2012: Announcement of accepted papers, the deadline for payment of the participation fee. October 31, 2012: Implementation Seminar Template papers downloaded here Detailed information and the application form can be downloaded from the leaflet pendaftara seminar here or contact the committee as follows. secretariat Maria Christina P., M.Eng. or Budi Suhendro, SST. College of Nuclear Technology - BATAN Jl. Post Office Box 6101 YKBB Babarsari Yogyakarta 55281 Tel: 0274-484085, 489716, Fax. 0274-489715 Hp: 0813 280 90 947 (SMS) - 0888 285 3010 (SMS) E-mail: seminar2012@sttn-batan.ac.id

Introduction to International Agreements on Nuclear Power

STTN, College of Nuclear Technology-BATAN Yogyakarta in cooperation with the Bureau of International Cooperation, Legal and Public Relations National Nuclear Energy Agency (BKHH-BATAN) held Introduction to International Agreements on Nuclear Power for Students STTN Semester 1 (a) Nuclear Teknokimia Prodi, Prodi Prodi Electrical and Electronic Instrumentation mechanics. The purpose of this introduction so that students understand what is called international law nuclear energy (nuclear law) The implementation in the Auditorium STTN-BATAN Yogyakarta on Saturday 27th November 2010 and was officially opened by the First Chairman Ir Penbantu Anis Noor Kundari, MT represents STTN-BATAN Chairman Prof. Dr. Kris Tri Basuki who was unable to attend. In this introduction was delivered 2 (two) material, namely: first "Introduction to NPP National Meet Energy Needs" presented by Dr. Ferhat Aziz he was head BKHH BATAN; second "Role of International Agreements on Nuclear Power in the Nuclear Utilization Destination For Peace" presented by Drs. Hasan Yaziz he was Head of Agreement BKHH. In the event it can be concluded that: nuclear power technology is now very safe, controlled waste produced by nuclear power plants, as well as HR Indonesia ready to operate nuclear power plants.

Prepare North Korean Nuclear Test

Based on a recent satellite imagery of the United States (U.S.), known to North Korea (North Korea) is preparing a nuclear test site. But can not be explained when the test would take place. Earlier this month, South Korean intelligence (ROK) reported it received evidence that the neighbors were digging tunnels in Punggye-ri. The tunnel is expected to be the new location of North Korea's nuclear test. Now through satellite imagery obtained by the US-Korea Institute Johns Hopkins School of Advanced International Studies, showed several photos of the suspected would be used as a nuclear test. The analysis shows, approximately 8000 cubic yards of debris collected reactors at the site. Previous location was also briefly used as a nuclear test North Korea in 2006 and 2009. "Clearly visible from this photo, North Korea amid preparations for a nuclear test over the last few months. Unclear time of the test will take place," said Joel Wit U.S. analysis, as quoted by the Associated Press on Saturday (28/04/2012) . If true North conducted a nuclear test, of course, criticism of the world will again flowing. Previously, efforts to launch their rockets had sparked criticism from the international community. Although in the end the rocket launch ends in failure. Latest nuclear test would certainly complicate the position of North Korea itself. There is a possibility that tougher new sanctions will be applied, when the Communist state remained adamant to perform the test. Punggyr-ri is located in the northeast region of the country. Through satellite imagery found that the work at the site has been going on since March. Recent photos show the mine cart, which is believed to bring the material removed from the test site. source : http://international.okezone.com/read/2012/04/28/413/620091/korut-persiapkan-tes-nuklir

INTEGRATED MODEL OF WATER COLUMN CORRECTION TECHNIQUE FOR IMPROVING SATELLITE-BASED BENTHIC HABITAT MAPPING: A Case Study on Part of Karimunjawa Islands, Indonesia

One of the most important factors that must be understood on the management of coastal area is the distribution of benthic habitat. Benthic habitat is an economically and ecologically important natural resource in coastal area. The distribution of benthic habitat can be well-presented using map. Benthic habitat map is a powerful tool for coastal management planning such as locating protected area, prediction species occurrence, evaluation of management effect and also biodiversity assessment. One of the cost-effective methods to provide such information with fast, high repetition and accurate result is using satellite image to map those resources in combination with field observation. Remote sensing technology allows us to produce good habitat maps. The problem is thehabitats are located submerged and limit the ability of remote sensing data to map the habitat. The aims of this study is to inverse the submerged reflectance into wet reflectance using integration of concepts on how pixels value over benthic habitat is recorded by sensor, water column attenuation, and bathymetry data. The accuracy of the integrated model will be compared with the accuracy of the existing model on each classification scheme. Last purpose is to combine the integrated model with PCA to get more detailed information on benthic habitat types. The hierarchical benthic habitat classifications were derived from ecological basis and habitat spectral separability analysis. The purpose of using hierarchical scheme is to cover all the possible existing habitat and to cover different management needs. The methods used in the study were conversion into surface reflectance, sunglint removal, water column and bathymetry generation, water depth invariant index, PCA (Principle Component Analysis) transformation and integrated model. Digital classification process was carried out using maximum likelihood with knowledge-based image segmentation. The result shows that the integrated model could inverse the submerged reflectance into wet reflectance but produced slightly lower accuracy compared to Lyzenga or PCA on each habitat classification scheme due to discrete zoning in bathymetry data. In classifying 5, 7, and 13 habitat class, Lyzenga was the most accurate with 79.59%, 74.73% and 37.89% accuracy respectively, PCA produced 82.65%, 71.57% and 37.89% respectively, and the integrated model produced 73.46%, 69.47% and 37.89% accuracy respectively. The combination of integrated model with PCA produced the most accurate result on the detailed classification scheme with average accuracy of 61.56% and overall accuracy 50%. The integrated model competes well with other methods on each classification scheme, especially on detailed classification scheme.

THE IMPACT OF LANDCOVER CHANGE ON DISCHARGE RESPONSE AND FLOOD HAZARD (A Case Study in Gesing Subwatershed, Indonesia)

Population growth provokes environment problems related to space. Interaction between human and environment is very complex. Human pressure causes forest conversion from forest to other land uses which is also expressed as conversions in land cover types. Those changes are mostly caused by economic and population growth reasons. People always maximize their land to get the best benefit by choosing the commodity that gives the best benefit. Population growth needs more space for their settlement, housing and farming so that people cut down the forest. The wood will be used to make their house. One of the effects of land cover is flood on the down stream. This research aims to analyze the pattern of land cover change during 1992 to 2003 and to analyze the effect of land cover change to the discharge and flood hazard on the down stream. Land cover change in Gesing subwatershed can be divided into three parts. Land cover in the upper part changed slightly. The down stream the changing is relative not significant. The most significant land cover change happened on the middle part of Gesing subwatershed. During 1992 to 2003 the forest area decreased from 2934.76 ha in 1992 to 2419.41 ha in 2003. In the same time, the barren land increased from 102.89 ha in 1992 to 455.24 ha in 2003. Plantation area also increased from 885.67 ha in 1992 to 1048.38 ha in 2003. Conversion from forest to plantation is the highest. Total conversion area from forest to plantation is 545.84 ha. The conversion from forest to plantation occurred because the people interested in clove that gives more benefit to them. Decreasing land cover influences a negative effect on hydrological processes. It affected to the discharge. The discharge in 1992 and 2003 were modeled using PCRaster. Based on the modeling, discharge during 1992 to 2003 increased 31.28m3/s. Discharge in 1992 is 79.97m3/s and discharge in 2003 is 111.24m3/s. Increasing discharge affects to the flood hazard on Piji Kibon. In this research, flood hazard was determined by flood height. The flood height in Piji Kibon was determined using kriging in ILWIS 3.3. Based on kriging, flood height increases during 1992 to 2003. Flood height in 1992 varies from 0-0.7m and flood height in 2003 varies from 0-0,98m. The flood extent also increased. The flood area in 2003 is wider than in 1992. The flood increasing flood height is not mainly caused by land cover change. It is also caused by the rainfall and may be caused by sedimentation on the river.

MODEL SIG-BINARY LOGISTIC REGRESSION PREDICTION FOR LAND USE CHANGES (CASE STUDY suburban YOGYAKARTA)

Dynamics of land-use change is always interesting and important to study because it is associated with a variety of global issues. This study aims to: (1) assess and predict changes in land use spatially using binary logistic regression model integration and GIS, and (2) assess the validity of the model in predicting changes in land use. Research located in six districts in the outskirts of the city of Yogyakarta daerarah. Changes in land use is predicted based on the probability value is calculated using binary logistic regression models. Predictor variable changes determined a priori and then selected based on a statistical test method Spearman and Mann-Whitney. Binary logistic regression model used was: Y = 0.8963 to 0.0200 X1 + 0.3551 X2 - 0.0002 X3 - X4 + 0.0002 + 0.0007 0.0003 X5 X6. Six predictor variables in the model are: (1) the distance to the main road, (2) the distance to local roads, (3) the distance of the campus, (4) the distance to land up, (5) the distance to the center of the economy and (6) the density of the road network. The validity of the model in predicting changes in land use dianalisisis using the ROC (Relative Operating Charactristic) and cross tabulation. The validity of the model represented by the actual value of the coefficient of agreement and Kappa statistics (). Model SIG-binary logistic regression generates predictions of land use changes that are spatial. Category changes the results predicted and actual change category actual value 81.8% agreement and Kappa statistics coefficient 0.24. Coefficient Kappa statistics showed agreement between the predictions and the actual conditions are included in the category of fair agreement. Model predictions generated from GIS-binary logistic regression tends to be over estimate.

IMAGE USE OF LANDSAT 7 ETM + TO SUSPECT standing volume PEAT SWAMP FOREST Tropical CENTRAL KALIMANTAN

The volume of forest stands is one of the results of the forest inventory as the basis for the preparation of a forest management plan. Tropical peat swamp forest in Central Kalimantan is very spacious with a difficult terrain to go. Inventory in all areas of peatland forests will require a long time and high cost. Remote sensing image is the solution to resolve the issue. The purpose of this study was: (1) Assess the coverage canopy peat swamp forests using transformations vegetation index digital data Landsat 7 ETM +, combined with field work and statistical analysis, (2) Predicting stand volume of peat swamp forest by using study the spectral coverage of the canopy; (3). Calculating the level of precision of the estimation of peat swamp forest stand volume obtained from the study of digital data spectral Landsat 7 ETM + imagery. The method used in this study is the technique of remote sensing digital image processing combined with field work and statistical analysis. Digital image processing is focused on aspects of the transformation of the vegetation index based on the pixel values ​​extracted from the image data of Landsat 7 ETM +. Rich tropical peat swamp forest canopy strata. In processing the strata canopy vegetation index will cause the shadow tree is a problem, because it will cause an error value of the index. This study will use the software that uses shadow correction and who do not use shadow correction. Both the software used is Forest Canopy Density (FCD) Mapper Version 1.0 and Enviromental for Visualizing Images (ENVI) version 4.2. FCD Mapper 1.0 is used to transform the Forest Canopy Density Index (FCDI) using the integration of four indices: Advances Vegetation Index (AVI), Bare Soil Index, Shadow Thermal Index and Index. ENVI 4.2 is used for the transformation of vegetation index using penisbahan between red and near infrared bands, namely Ratio Vegetation Index (RVI), Normalized Difference Vegetation Index (NDVI), Transformed Vegetation Index (TVI), Different Vegetation Index (DVI), Soil Adjusted Vegetation Index (SAVI) and Modified Soil Adjusted Vegetation Index (MSAVI). Forest class divisions based on digital classification results of each vegetation index transformation. Multispectral classification used is terselia classification (supervised classification) using the maximum likelihood algorithm (maximum likelihood algorithm). Using canopy coverage class divisions by class division that issued by the ITTO FCDI - JOFCA 2003 with modifications. Survey fieldwork was conducted at 32 sites each sample site sample consists of 9 pixels. Tree canopy density was measured at 9 pixels, but stand density, diameter, branch-free height, plant height and the height and other data required only measured at 2 pixels from each site selected examples. Data transformed vegetation index derived from Landsat 7 ETM + imagery and field parameters were analyzed using multiple regression models-correlation. The results of statistical calculations are used to observe the effect xvparameter field in the regression model. Regression models that qualify will be used to calculate the volume of the stand. These results indicate that it can be used to distinguish FCDI canopy coverage in tropical peat swamp forests to achieve 85.71% accuracy. What it means is that it can be used to assess FCDI peat swamp forest and tropical rain forest-rich tropical canopy layer. Instead of distinguishing canopy coverage, RVI, MSAVI, TVI, NDVI, SAVI and DVI each sequence can only provide accuracy at 65.01%, 64.86%, 61.41%, 61.15%, 59.14% and 55.92%. The case of the 543 and 453 composite image also shows the same thing. This means that both methods can not be used to assess the tropical peat swamp forests. Types of tropical peat swamp forest study area is peat swamp forest types 5 and 6, which means Whitmore classification rich canopy layer. FCDI can be inferred from the volume of forest stands within one pixel Landsat regression model Y = (X - 7.24) / 112.84 or forest stand volume = (FCDI - 7.24) / 112.84 with r = 0.90. Therefore, FCDI can be used to perform the analysis of canopy coverage and structure of peat swamp forest and tropical rain forests are rich with layers of canopy.

CLASSIFICATION OF DECISION TREE FOR THE STUDY OF LAND USE CHANGES USING IMAGE CITY SEMARANG LANDSAT TM / ETM +

This study took place in the city of Semarang. The purpose of this study were: (1) to compare the accuracy of the map of land use decision tree classification results with maps of land use classification results maximum likeness integrated with geographic information systems, (2) an inventory of Semarang land use classification methods that have the highest accuracy in the data Landsat multiwaktu, (3) assess changes in land use classification results Semarang city that has a higher accuracy rate. The method used in this study using the classification decision tree for mapping land use that incorporates 6 channels spectral Landsat TM / ETM + path / row 120/65 recording in 1994, 2002 and 2006 with layer support, namely: the maps results Transformation Kauth and Thomas, NDVI (Normalized Difference Vegetation Index), NDBI (Normalized Difference Building Index), vegetation index, and spatial data such as maps of landforms, soil maps, elevation maps and map slopes. For comparison selected the maximum similarity classification, integrated with a geographic information system to be reduced to the land use map. Land use classification used has two different levels of detail for the scale of 1: 100,000 and 1: 250,000. The results of the two methods above then compared the level of overall accuracy, user's accuracy and producer accuracy and Kappa index. Highest level of accuracy will serve as an inventory of land use data for the city of Semarang. The next method is to assess changes in land use of Semarang visually using the road network and a map of Semarang RTRW Year 2000-2010. In this study show that the classification results of land use map decision tree has an overall accuracy rate (overall accuracy) and Kappa index were higher than the maximum similarity classification results are integrated with geographic infromasi system. The results of land use classification level I have better accuracy than the land use classification level II. For classification level on the map in 1994 I obtained 54.14% accuracy with a Kappa index of 0.4822 for maximum similarity and classification accuracy of 66.34% with a Kappa index of 0.6256 for the classification decision tree. In the 2002 map obtained results with an overall accuracy of 75.12% Kappa index of 0.713 for maximum similarity and classification accuracy of 81.46% with a Kappa index of 0.787 for the classification decision tree. On the map in 2006 obtained an overall accuracy of 78.05% with a Kappa index of 0.7641 for maximum similarity and classification accuracy of 82.45% with a Kappa index of 0.805 to map land use decision tree classification results. Changes in land use in the city of Semarang lead to a decrease in agricultural land and plantations and the growing residential and industrial.

INTEGRATED MODEL OF WATER COLUMN CORRECTION TECHNIQUE FOR IMPROVING SATELLITE-BASED BENTHIC HABITAT MAPPING: A Case Study on Part of Karimunjawa Islands, Indonesia

One of the most important factors that must be understood on the management of coastal area is the distribution of benthic habitat. Benthic habitat is an economically and ecologically important natural resource in coastal area. The distribution of benthic habitat can be well-presented using map. Benthic habitat map is a powerful tool for coastal management planning such as locating protected area, prediction species occurrence, evaluation of management effect and also biodiversity assessment. One of the cost-effective methods to provide such information with fast, high repetition and accurate result is using satellite image to map those resources in combination with field observation. Remote sensing technology allows us to produce good habitat maps. The problem is thehabitats are located submerged and limit the ability of remote sensing data to map the habitat. The aims of this study is to inverse the submerged reflectance into wet reflectance using integration of concepts on how pixels value over benthic habitat is recorded by sensor, water column attenuation, and bathymetry data. The accuracy of the integrated model will be compared with the accuracy of the existing model on each classification scheme. Last purpose is to combine the integrated model with PCA to get more detailed information on benthic habitat types. The hierarchical benthic habitat classifications were derived from ecological basis and habitat spectral separability analysis. The purpose of using hierarchical scheme is to cover all the possible existing habitat and to cover different management needs. The methods used in the study were conversion into surface reflectance, sunglint removal, water column and bathymetry generation, water depth invariant index, PCA (Principle Component Analysis) transformation and integrated model. Digital classification process was carried out using maximum likelihood with knowledge-based image segmentation. The result shows that the integrated model could inverse the submerged reflectance into wet reflectance but produced slightly lower accuracy compared to Lyzenga or PCA on each habitat classification scheme due to discrete zoning in bathymetry data. In classifying 5, 7, and 13 habitat class, Lyzenga was the most accurate with 79.59%, 74.73% and 37.89% accuracy respectively, PCA produced 82.65%, 71.57% and 37.89% respectively, and the integrated model produced 73.46%, 69.47% and 37.89% accuracy respectively. The combination of integrated model with PCA produced the most accurate result on the detailed classification scheme with average accuracy of 61.56% and overall accuracy 50%. The integrated model competes well with other methods on each classification scheme, especially on detailed classification scheme.

CLASSIFICATION BASED ON OBJECT ORIENTED ANALYSIS SEGMENTATION IMAGE SENSING FOR MUCH OF HIGH SPATIAL RESOLUTION

Remote sensing from satellites and aircraft rides, one of which produces the appearance of the earth's surface the data in detail for use in analysis or monitoring changes. Highly detailed image data (high spatial resolution) digital image processing method requires a more specialized object-oriented classification is based segmentation. Segmentation algorithms are pretty much going to raise the question, which is the most appropriate method is used for object-oriented classification for remote sensing image analysis of high spatial resolution. The purpose of this research is to create a system for classifying satellite remote sensing imagery with high spatial resolution of the object-oriented classification based on multiresolution image segmentation. Segmentation method used is KMeans Image Clustering, Fuzzy CMeans Image Clustering, KMeans Region Clusterer, Simple Region Growing, and Statistical Region Merging, Mean Shift. Six methods were compared with the classification accuracy of the results of field checks of data, to determine what the most appropriate method. The results showed segmentation method with Mean Shift algorithm has the highest accuracy compared to five other algorithms. When compared with classification without using segmentation (the original image), there is an increase up to 40.9% accuracy so it can be concluded segmentation method is an appropriate method for digital classification of high spatial resolution satellite imagery.

SPATIAL MODELLING ROAD ROUTE approach REGIONAL AIR BASE OPERATION MILITARY DISTRICT Atang SENDJAYA BOGOR ASTER IMAGE USE AND GEOGRAPHIC INFORMATION SYSTEM

Geographic Information Systems and Remote sensing can be used to analyze the field in route determination approach in the area of ​​military operations. Approach route is one of the aspects of military tactical route information which can be crossed by military vehicles. For the purposes of air base defense, approach routes used to anticipate the direction of the entry of the enemy in carrying out the attack. The purpose of this study were 1) Assessing the accuracy of land cover interpretation of results Aster digital imagery with multispectral classification system to map the terrain obstacles variables are used as input data in determining the approach route, 2) spatial modeling approach route area of ​​military operations for the defense of the base Lanud ATS. The method used in determining the route distance and the cost approach is cost path analysis that works on raster-based data model in GIS. In this method, the route will be created automatically based on the accumulation of the smallest travel time. This means that any route is the best route formed by the point of departure for a pre-determined targets, as always traverse terrain that has the least resistance. Necessary variables in the study consisted of: 1) slope taken from RBI map 1: 25,000, 2) soil bearing capacity derived from the consistency of the soil, 3) terrain obstacles is obtained by identifying the land cover produced from digital images interpreasi daisies terselia multispectral classification system uses the maximum likelihood algorithm, and 4) technical specifications M113 APCs. The results consist of: 1) Interpretation of digital image with sitem Aster multispectral classification produced 16 land cover classes with an average accuracy rate of 91.68%, 2) spatial modeling approach route produces 6 routes that can be used as the M113 APC entry to ATS air base runway. Each route provides information of distance, travel time, and average speed depends on terrain condition dilintasinya. Shortest route is the route I within 4.28 miles and takes about 0.57 hours and an average speed of 7.49 km / h. Conditions terrain crossed by the route 1 consists of 65.65% flat slopes, and 49.12% of land cover in the form of vegetables and 100% consistency of soft soil. The longest route is Route 4 which has a route length of 7.63 km, 1.16 hours of travel time and average speed of 6.56 km / h. Traversed the terrain consists of 44.95% rute4 slope flat and hurdle crossed in the form of 47.83% such as vegetables, and 100% consistency of soft soil.

Esri UC Call for Papers - Storytellers Wanted

The Esri International User Conference (Esri UC) is focused on your meaningful and influential work. We are looking for users who will bring inspired ArcGIS ideas, insightful best practices, game-changing web maps, and revolutionary geospatial solutions that are making a difference in our world. Bring your story to life and share your work experiences and expertise with more than 15,000 of your GIS colleagues at the San Diego Convention Center, July 8 - 12, 2013. "The opportunity for networking was immense - so many people stayed after the session to talk and trade cards with me and the other presenters. Making connections with other GIS professionals interested in renewable energy has opened up new avenues for sharing information and experiences."

Three protesters 'Innocence of Muslims' killed in Sudan


Three people were killed while protesting against the film Innocence of Muslims outside the U.S. embassy in Sudan, Friday (14/9).

However, a short news broadcast by one radio that Sudan does not provide details about the incident.

Radio broadcasts were only mentioned that the police fired tear gas and used batons to try to disperse thousands of protesters who tried to storm the embassy. Some of the protesters had entered the complex U.S. representative.

While in Tunisia, at least three people were killed and 28 others injured after police clashed with hundreds of protesters who tried to storm the U.S. Embassy associated with the film of the Prophet Muhammad.

A day earlier in Yemen, clashes after demonstrators stormed the U.S. Embassy killed four protesters and injured 48 people. Victims included 10 members of the security forces assigned to guard the embassy.

Protesters angry over the film Innocence of Muslims deemed insulting to Islam. The film has sparked outrage in various parts of the region, and the attacks carried out against a number of embassies in Sudan, Tunisia, and Egypt.

U.S. Ambassador to Libya Christopher Stevens and three other U.S. citizens were killed after gunmen. The attackers were part of the mob that blamed the United States for a film that was deemed insulting to the Prophet Muhammad.

U.S. President Barack Obama promised to prosecute those responsible for the attacks on Benghazi jatab. U.S. officials suspect the attack was pre-planned.
<!-- adsense -->
U.S. Secretary of State Hillary Clinton said Washington has no connection with the film called "disgusting and despicable" the

Egypt's Muslim Brotherhood Demo Call Disconnect the 'Innocence of Muslims'


Influential group in Egypt, the Muslim Brotherhood revoke his call for holding peaceful demonstrations across Egypt to protest amateur film 'Innocence of Muslims' that has been degrading Islam and the Prophet Muhammad. Those states will only participate in the protests are 'symbolic'.

"Highlighting the events that occurred in the last 2 days, the Brotherhood decided to participate only in a symbolic protest in Tahrir Square, so there will be no further action destruction of property, or injured, or killed, as was the case before," said Secretary General of the Brotherhood Muslims, Mahmoud Hussein, in a statement quoted by AFP on Friday (09/14/2012).

Earlier on Thursday (13/9) local time, Egypt's Muslim Brotherhood called for nationwide demonstrations to protest the film 'Innocence of Muslims'. In a statement, Mahmud Hussein called on all Muslims in Egypt to hold peaceful demonstrations on Friday (14/9) local time.

"Actions peaceful demonstration on Friday, September 14th at all major mosques in the province of Egypt to condemn insult religion and the Prophet," he said. Hussein also called on all nations to join forces in protest.

But apparently, some worry Brotherhood rally will culminate clashes and casualties. Because, today only clashes between protesters and police reportedly broke out in the office the U.S. Embassy in Cairo, Egypt. The protesters threw stones at police who then replied with teargas.

The demonstrators, mostly teens still, moving closer to the U.S. Embassy in Cairo in small groups. They even do not hesitate to throw rocks at police who tried to block them. The streets around the U.S. Embassy office is in downtown Cairo is also filled with rocks and gravel.

Film 'Innocence of Muslims' sparked some protests in the Middle East and North Africa. Offices of the U.S. Embassy in Egypt, Libya, Yemen, Iran and Tunisia was invaded by protesters even casualties. U.S. Ambassador in Libya, Christopher Stevens, diplomatic staff and their three demonstrators were killed in raids in Benghazi, Libya. While 4 protesters shot dead in Yemen police who tried to disperse the crowd.
<!-- adsense -->
While in Egypt, on Thursday (13/9), reported that about 224 people were injured in clashes between demonstrators and police outside the U.S. Embassy. Of these, eight of whom still have to be hospitalized until now.

Film director insulting Prophet Muhammad Hide


California - the Israeli film director, Sam Bacile, who now lives in California, USA, went into hiding after the film direction of the Prophet Muhammad enraged Muslims in Libya and Egypt.
Speaking by phone from his hideout, screenwriter and director Sam Bacile remain in his opinion that Islam "as a cancer". 56-year-old man said that he deliberately made the film as a form of political provocation to condemn religion.
Inevitably, the film Bacile anger Libyans and Egyptians, Tuesday, September 11, 2012, by burning the movie and attacked the U.S. consulate in the city of Benghazi. They also killed U.S. diplomat there. In Egypt, as public anger acted to the U.S. embassy in Cairo. The protesters climbed the embassy walls to replace the U.S. flag with the Islamic banner.
"This is a political movie," said Bacile. "The United States lost a lot of money and troops in Iraq and Afghanistan, but we were fighting idologi."
Bacile, a property entrepreneur in California who identified himself as an Israeli Jew, said he believes the film will help to expose the weakness of his homeland of Islam to the world. "Islam is a cancer," he said.
Bacile explains, this two-hour film production has cost U.S. $ 5 million (USD 48 billion). All funds shall be borne jointly and severally by the approximately 100 Jewish donors. In the film, Bacile depicting the Prophet Muhammad was an impostor. To watch the footage, the film is viewed on YouTube a duration of 13 minutes in English.
He also called the Prophet Muhammad a philanderer weak and approve of sexual abuse in children. The film is regarded by Muslims as an insult to the Prophet Muhammad lord.
Despicable attacks against the Prophet Muhammad was not just this once. Previously, the Danish newspaper edition of 2005, published 12 caricatures of the Prophet Muhammad that sparked riots in the Muslim countries.
Jewish man went on, he was concerned about the deaths of American citizens who died in the movie. He blamed the lack of security of the Embassy and the violence in Libya. "I think the security system (at the embassy) is not good," said Bacile. "Americans have to pass something to change it."
A movie director, Steve Klein, said filmmaker need to give attention to family members who live in Egypt. However Bacile rejected that argument. Klein said, he promised to keep helping Bacile make movies, but he warned, "In the future, you will be Theo van Gogh."
Van Gogh was a Dutch filmmaker, who was murdered by a Muslim extremist in 2004 after making a film deemed insulting to Islam.
<!-- adsense -->
"We remind you that this (murder) could happen to you," said Klein.
Bacile films dubbed into Arabic by a stranger. Film producers who can speak Arabic is confirmed that the film has been translated into Arabic accurate. This film was made in three months in the summer of 2011, supported by 59 actors and about 45 people behind the camera. "When playing in theaters Hollywwod bioksop earlier this year, the building seats empty," said Bacile.

Anti-Islam Film Actress Innocence of Muslims Trauma


Actress Cindy Lee Garcia did not think the movie that starred, Innocence of Muslims, would trigger a bloody protests in several countries. "It drove me crazy," he said in an interview with Gawker, Wednesday, September 12, 2012.
This controversial film is considered disrespectful to discredit the figure of the Prophet Muhammad. As a result, a number of angry Muslim society. In this movie-related protests in Benghazi, Libya, four U.S. diplomats killed diroket and pathetic as his office burned.
"The director told me (while filming), it's just a regular movie set in Egypt 2,000 years ago," said the actress from Bakersfield, California. In the film, he played a small role as a woman who gave her in marriage to the Prophet Muhammad.\
<!-- adsense -->
"In the film, not that I know of Muhammad's role, but Master George," he said.
Name Muhammad himself dialihsuarakan by the director on the post-production process. Knowing that, he was very furious with the director and producer because they feel exploited. In effect, he was traumatized. "Someone killed because kubintangi movie," he said.
The results of the recognition of the film's final editing so awful. Especially after seeing the impact of the film titled Desert Warriors knew it. The film has been edited and then uploaded the footage to YouTube. Snapshot is what makes Muslims angry. Besides Libya, in Egypt also recorded a massive demonstration protesting this movie.

Protest Film 'Innocence of Muslims' Student Demo Iran Embassy of Switzerland


A number of Iranian students in Tehran to protest in front of the Swiss Embassy in Tehran, following a protest against the controversial film 'Innocence of Muslims', which also triggered a wave of action in some Islamic countries and resulted in the death of the U.S. Ambassador in Libya.

As reported by the Fars news agency on Thursday (09/14/2012), the protesters came from a student organization.

"They called on Muslim countries to cut off diplomatic relations with the United States," Fars said, as reported by Reuters.

They support the demonstration triggered reactions from the film that are considered controversial, including providing support for the protesters in Libya and Egypt, while shouting "Muslim Unity" and "Muhammad is the Messenger of Allah".
<!-- adsense -->
Iran's supreme leader, Ayatollah Ali Khamaeni accused the Zionists and the United States was behind the film as well as the prime suspect.

Protesters stormed the U.S. embassy in Yemen on Thursday, following the anti-US protests in Libya and Egypt.

TRAINING MODULE DEVELOPMENT TRAINING INDEX KERETANAN BEACH Elevation Data Processing Module / Altitude TWO PARTS

10. On this page in the download file is ready, there are two ways to download a file,
ie download files individually or download all the files directly. on
this exercise we will download the file once  click the Download menu for
download

11. Next will be a process of rendering the data  after rendering the data
 complete directory then you will be asked penimpanan file / data download 
store the data according to your Desire


2. Wait for file storage process is completed  if the downloaded file is
complete, the download process or the completion of data acquisition

PHASE DATA PROCESSING
In the two DEM data processing software used to process
processing, namely the Global Mapper and ArcGIS 9.2 is dikengkapi with Hawths
Analysis Tools. In general there are several steps in the processing of DEM data, between
Another reading of the data, crooping data, extraction of data, reading data into ArcGIS, search
slope, Grid statisitk each cell, the integration of data into GIS. Complete the following steps in
data processing:
a. Reading of data
GDEM data (Global Digital Elevation Model) format downloaded from the internet "zip"
and consists of several files, to open the file and merge it used
Global Mapper software. Here are the steps the reading process,
merger, and the data in Global Mapper pengeksportan
A. Open the Global Mapper program that has been installed on your computer  Start 
Global Mapper program   Next, you'll go to the main page
Global Mapper as follows:

2. Open the file in a way GDEM  File  Open Data File (s)  locate the data file in the directory
storage of your data (D: \ @-IK-Training \ Module-7-DEM \ 1_Data_asli)  Select the file
you want to open it (press the CTRL key on your keyboard to select the data file is more than
a)  open  click menu click Yes All the time there is a warning window on the Global
Mapper  Wait a moment, then the file will open

3. You will see GDEM file open, then there are some configuration
selection of data in a way  Select  Tools menu  Control Center Uncecklist all
file "NUM" because we're not using Option   click on the window Elevation
Alter Elevation Values ​​select Options make sure the units of meters   Minimum sure
Valid Elevation bernila zero   click OK and then click Close to close the menu
window

4. Once configuration is completed next export data according to region
Click the desired file   Export Raster and Elevation Data DEM  Export  on
DEM Export Options window select the menu  Export Bounds set the coordinates of the
you inginkkan, in this training we will download the Tangerang area with
boundary coordinates 106 345 BT - BT 106 767 and LS 5695 - 6:15 LS  save the file on
Your directory (D: \ @-IK-Training \ Module-7-DEM \ 3_Data_hasil_olahan) give the name of the file
to your liking  Wait for the export of up to 100%  export process
the data is complete


b. Analysis of Data in ArcGIS
ArcGIS program outcome data on exports in the analysis to determine the value of the slope
(slope) correspond to cells that have been made ​​in the previous exercise (module Introduction
GIS). Slope values ​​are taken (croop) just inside the cell, because the
one cell there are a lot of the slope, the next value in the same cell
are averaged to obtain one value in one cell. Step - a step
More as follows:
A. Open the ArcGIS program on your computer  Start  Programs  ArcGIS ArcMap  
set of projection systems with Geographical coordinates with datum WGS 1984
2. Before opening the DEM file from Global Mapper first activate the cell layer
that have been made ​​before, on this exercise I used the cell
tangerang by the number of cells 51. These cells will serve as the cutter
(crooper) slope values ​​that are within the cell. How to open a layer with
Click to Add Data   looking layer of cells on your computer directory, in the exercise
These cells are in the directory file D: \ @-IK-Training \ Module-7-DEM \ 2_Data_Peta \ cell  select
clip_elevasi_geo_tangerang.shp  click Add

3. After the active cell layer then open the DEM files exported from Global Mapper results
by means of data  Add  locate the file in your directory, in the exercise files
located in the directory D: \ @-IK-Training \ Module-7-DEM \ 3_Data_hasil_olahan  select file


4. The next step is to determine the value of the slope (slope) of the composite layer.
Before starting the determination of the slope of the analyst and make sure the 3D Toolbar
Hawth's tools in the active state  Select the menu View  Toolbars

5. Determination of the value of the slope ready to do the 3D Analyst menu  Select  Surface Analysis
 select Slope

6. Once the menu is selected slope you will go into the configuration menu  Ensure slope
input surface: gabungan.dem (or any other raster file)  select ouput mesurement
percent  Z factor: 0.00000899281  output cell size allow the default value  output
raster: save in the directory D: \ @-IK-Training \ Module-7-DEM \ 3_Data_hasil_olahan 
file name  click OK

Description:
 Ouput mesurement:  percent is a unit of the slope in
percent. The concept unit of percent on the slant is presented such as picture
the following:

 Z  factor is a unit adjustment factor, because the unit value of Z
(elevation) is then the meter must be adjusted to the system unit
coordinates is degrees. Z factor value is 1, assuming a value of 1
o
is 111.2 km then 1 meter equal to 0.00000899281
o
7. Wait a few moments to complete the process pemebentukan slope, after
process is finished slope will automatically appear as a new layer in the
ArcGIS as follows:

8. The next step is to take (crooping) which resides in the value of the slope
cells by using the Hawth's tools. This tool is capable of averaging the values ​​in
in the cell, so that in each cell just out of the slope. Select the menu
Hawth's tools  Tools  Zonal Statistics Raster (+ +)


9. Next, you will be asked to make choices in crooping value
 In the zonal slope of the polygon layer select a data cell that serves as a boundary
crooping (in this case we use the file clip_elevasi_geo_tangerang.shp)  on
select the raster layer slope (the slope of the layer formation process results)  select the output
table name in accordance with your wishes to save  Ok 

10. Wait a while until the process is complete crooping. When finished be sure
that the croping process successfully and have a logical value. Crooping results file
have the format "DBF" so that it can be seen directly with ArcGIS. The values
coming out of the crooping is a minimum value, maximum, average, standard
deviation, and the number in each cell, because the cells used amounted to 51 so
outgoing data lines are also numbered 51. In this training we just membutuhakan
the average value in each cell for the parameter determining coastal vulnerability index.
Here is an example of the output data crooping

c. Combining the data slope (slope) into the cell
The process of incorporation is the stage where the value of the slope (slope) is inserted
into the attributes of cells for GIS analysis. This process is quite easy because
just do a join table only. The steps are as follows:
A. Make sure the ArcGIS there are two active layers, the layer of cells
(clip_elevasi_geo_tangerang) and layer slope (crooping_slope)
2. Because at this training we just membutuhakan average value of the slope on
each cell then delete the values ​​that do not need, such as tilapia minimum, maximum,
standard deviation, and number. Removal steps are  right click
crooping_slope layer  open   active after the table right click on the header of data
 delete field

3. After the delete process is completed then the join table  do  ready click
Right on the layer clip_elevasi_geo_tangerang Join and Relates   select join

4. Next, you'll go to the menu options in the join table as
the following:

Adjust the options-increments as shown above
5. Table join process is completed  sample of the join is as follows:

TRAINING MODULE DEVELOPMENT TRAINING INDEX KERETANAN BEACH and Elevation Data Processing Module / Elevation PART ONE

One satau parameter in determining the elevation of coastal vulnerability index
or slope. The importance of information on coastal elevation data relating
to estimate inundation area face rising sea levels. by knowing the
elevation information of an area it can be estimated well and the wide range of land
to be inundated due to sea level rise looks at each particular hike,
locations to determine areas prone to inundation.
There are many ways in the present elevation of the earth's surface in the form
Digital. One way to present the earth's surface with storage
limited capacity is a Digital Elevation Model (DEM). DEM is
one model to describe the shape of the earth surface topography that can
visualized in 3D (three dimensional). There are many ways to obtain
DEM data, interferometry SAR (Synthetic Aperture Radar) is one of the algorithms
to make a relatively new DEM data. SAR image data or a radar image
used in the process of interferometry can be obtained from satellite or airplane rides,
apart from the radar DEM can also be obtained from the ASTER image. In this training DEM data
which will be used for the GDEM (Global Digital Elevation Model) derived from satellite
ASTER (Advanced Spaceborne Thermal Emission and Reflection Radiometer). GDEM
have ketilitian (spatial resolution) are pretty good that is 30 meters, while
coverage area is nearly the entire surface of the earth is covered in the data GDEM. data
GDEM can be downloaded (download) for free on the internet through the website
http://www.gdem.aster.ersdac.or.jp, which issued the data format is TIF (Tag Image
Format) which can be opened directly diperangkat GIS software, making it easier for
needs further analysis

DATA ACQUISITION PHASE (DOWNLOAD)
In general, the process of downloading the data, there are three main stages to be passed,
the registration as a member, select the desired area, the latter is
download the data. in detail here are the steps in the process
download data:
A. Type the website address into the address bar http://www.gdem.aster.ersdac.or.jp
browser, in which case we are using Mozilla Firefox, then press enter


2. If your computer is connected to the internet it will show a web page
as follows:


3. Click on register & modification to register  then you will fit in
form filling of personal data

4. Fill the form in accordance with his orders, which marked with an asterisk (*) is
sign a required field command  After filling the form is complete click the menu button
Next  if the registration is successful then you will return to the main page and
means that the registration was successful, and your user name will be printed on the left
top right corner

5. Then click the Search menu to start your search DEM data  you will go
to map the following page

6. With the help of a computer mouse to enlarge the area you want
download  in this case we will enlarge the area tangerang

7. Before the download of data you must first choose a location where
Just that you will donwload  Select tiles directly select menu and then click the menu 
Start  then the cursor will change shape like a plus sign (plus) next 
Click the area you want, in this case we choose the Tangerang

8. Once you selected the location  Next  then click menu then the data will
display and ready for dowload


9. Once the data is in the download is performed  Click Next to enter the menu
agreement page  Select purpose choose the menu Climate (as needed
you)   Agree then click menu then you will go to the download page

ANALYSIS SRTM DEM accuracy DISTRICT LEVEL DATA MOUNTAIN WEST JAVA SALAK BANDUNG


Information cover / land use derived from Landsat-7 imagery created by LAPAN, while the elevation data obtained from the RAN and is used as a reference. Because it is used as a reference it is assumed that the accuracy of the height of the topographical map 1:25.000 scale better than the accuracy of height-SRTM DEM data.
Areas that are used as research samples (Figure 1) is part of West Java region representing a variety of heights and types of cover / land use. The studied region covers an area of ​​Tangerang, Jakarta, Jakarta, to the south to the coastal district Cianjur.
1.2. Cover / land use in West Java
Cover / land use that are used are made from interpretation of Landsat satellite imagery from 2002-2003 made ​​by Pusbangja on the inventory of natural resources in 2004, the interpretation done on a scale of 1:100,000 mapping. Figure 2 below shows the information cover / land use in West Java.


2. RESEARCH METHODOLOGY
The first is the extraction of the position / location and the high point of the scale topographical map 1:25.000 with a way to scan the map into data jpeg, jpeg then the data scanned so as to have corrected the geometry of geographic coordinates and stored in a format ECw. From the data of the geometry correction is done deleniasi / high point for the identification of the point obtained geographic coordinates and altitude information at that point. The position coordinates with the data obtained dioverlay cover / land use and SRTM DEM data so that each position coordinates of the real has information height (from the data map form of the earth), the type of land cover, and elevation of the SRTM DEM data.
Areas studied were divided into 2 parts (left and right parts) (Fig. 3). The results of statistical analysis of the first region to be a comparison / control statistical analysis of the results of section 2. By comparing statistics obtained from the two regions will be known how far the influence of differences in land cover to the value of height-SRTM DEM data.
Coordinate information of each position are grouped by type of land cover. Land cover classes used were forests, plantations, groves, open land, farm / moor, ponds, irrigated fields, villages, and cities.
Once grouped by land cover units for each observed position coordinates of the high points of information obtained from topographical maps and SRTM DEM of the data compared, and the statistics are made about the height difference (mean difference and the deviation of the difference). By knowing the average difference and the deviation of the difference it will be known how much precision measurement of the height of the SRTM DEM dipeleh of the data.


3. RESULTS AND DISCUSSION
Overlay geographical coordinates of points that contains the height information from topographical maps, the DEM-SRTM, and type of cover / land use can be seen in Figure 4. In the table overlay results are presented in Table 1.
From Table 1 performed grouping data based on land cover, each group statistical difference measurement computed data. Table 2 shows the statistical results of the measurement differences between the SRTM-DEM data with topographical elevation data for the region to the right.

Topographic-and SRTM DEM about 15 meters, this suggests that the results of measurements of the height-SRTM DEM is 15 meters higher than the topographical elevation data, this difference is caused by the height of forest land and plantations cover an average of 15 meters. The object being measured height of the DEM data is the surface cover or canopy of the forest or plantation while measured by the topographical map is the height from ground level. Differences in the measured object from the data (DEM and rpbm) requires that the height calibration, data-SRTM DEM needs to be calibrated or decreased in value based on the height of land cover.
To groves and fields of land cover / dry shown by Table 2, the measurement height of 3-4 meter DEM data is higher. As an explanation for the forests and plantations due to the above then this is the average height of shrub land cover and farm / moor is 3 to 4 meters. As for the other land cover farms, open land, fields, villages and urban land cover in the absence of a significant elevation caused by measurement of the relative SRTM DEM data, together with topographical height of the data. Object of the water body is not included in the analysis because of the height of the water body is calculated in the algorithm fails interferometry (discontinew).
Accuracy of measurements taken from SRTM DEM data, indicated by the standard

deviation of the difference measurement. For forests and plantations standard deviation values ​​of table 2 is about 13 meters, this means that the height measurement accuracy of the data-SRTM DEM is 13 meters. Measurement error of 13 meters is caused by variations in elevation than the land cover of forest or plantation is also caused by internal errors of the SRTM-DEM data.
Precision measurement of the height of the paddy fields and ponds around 1-2 meters, due to variations in land cover ponds and rice fields almost no (<1 meter), then the measurement error of 1-2 meters of paddy fields and ponds due to internal error-SRTM DEM data itself.
In general, that the data-SRTM DEM has two kinds of errors, the first error caused by variations in the height of land cover and the second error of the system that produces a data-SRTM DEM (internal error). From Table 2 and described above then the measurement error resulting from the production system-SRTM DEM data ranges from 2 meters, while the other error resulting from land cover types.
Table 3 shows the results of measuring the difference between statitik-SRTM DEM data with topographical elevation data for the region to the left.

On the left side of the average height of forest and plantation areas is lower than the right. In contrast to the region on the right side where the altitude forests and plantations are the same then the average height of the plantations in this region is lower than the forest. Keteltian level height in forest cover on the right (12 meters) higher than the precision on the left (18 meters).
From the analysis of Table 2 and Table 3 above turns out that the accuracy of different heights to the left and right, the average difference in elevation for each land use in the second part is also different. There are two similarities of the two tables above, the first is that the higher elevation land covers the measurement of the average difference between the SRTM-DEM data with greater topographical elevation data, the higher the variation in the value of the land cover greater heights so that the level of accuracy to be lower third measurement accuracy of the DEM-SRTM elevation is below 20 meters, whereas if the forests did not exist then the measurement accuracy to below 13 meters, while for paddy fields, ponds had the highest ketelitin is under 3 meters.

4. CONCLUSION
The conclusion of this study are:
- Land cover affect the accuracy of measurement data, the SRTM DEM
- Value-SRTM DEM on land with a high elevation (forest plantations) need to do calibration
(reduction).
- The measurement accuracy depends on the SRTM DEM, land cover, forest land where the lowest
measurement accuracy, while in the fishponds, the highest measurement accuracy sawa.
- The level of measurement error-SRTM DEM data are generally below 20 meters

5. ADVICE
The use of SRTM-DEM data for mapping purposes should consider the mapped region, if the area is generally mapped wetland, the SRTM DEM data can be used for large-scale mapping
greater, whereas if the hills where most of the forest land cover data usage SRTM DEM-scale maps are used to lower

LIMITATIONS OR DISASTER MITIGATION frustration?


The two key words rather just posted to probe further the idea of ​​disaster management which is run in one district in the western part of a province in Sumatra Island's famous coffee. There is a fact that intrigued me when splitting the hills there. There is a tremendous project to secure the hills there, aka miscarriage of landslide disaster area. The hills there made "tie legs".
Tie the legs is a term that I chose. Let's look at the photos I got on the field. If we assume a hill as a private figure like a man then of course there is the position of the belt in a belt worth mentioning. The belt is better suited for so-called connective feet foot binding function. And what is interesting to ditelisik? The answer is the idea of ​​making the leg tie.
Some years we get education about land erosion through many media. Erosion-landslide that occurred in Indonesia land move stakeholders with an interest in the world to deliver something for the sake of common security. And of course the intended target. So I was confident to invite readers to review the discussion this time without in-depth intro.
There is an important factor triggering the occurrence of land slides that seemed neglected in disaster mitigation project nesting. Trigger landslides in the form of land not only deforestation in the hinterland. In fact, if we are careful even then we may be widened. For, though dense forest area will not guarantee free land slides. Forest entity has an actual mass at a certain point of climax would be a burden to sustain yag land. Last factor is what I mean? Factor is the area of ​​slip!
It is not true assumption that the layer of soil or rock that make up the Earth's surface is located on flat water as well as parallel stacked. I describe these Kekurangpemahaman Juka will look like this.


We need to recall that there are two workers who work on the earth's surface. Tersebutlah forces that shape Earth's surface configuration. The result is the formation of hills, valleys, and so forth. The labor force is generally specified as endogenous and exogenous. So we must always realize that the layers of soil and rock is very diverse. Variety is related to the position, direction, combination, and slope.
An understanding of variations in the configuration of the earth's surface layer should lead us to an issue critical to the land. The field is a field that limits the sliding element 2 layers of different characters. Eg soil layer above the layer of volcanic rock is hard and slippery. The field of slip becomes important to observe because it's a case of conditions (different characters) ketidakkompakan impact on these elements. If compactness is not guaranteed then keterceraiberaian just a matter of time. In the volcanic soil and rock samples, increasing the risk of land slides in the event of heavy rain so the water soak into the ground until contact with volcanic rocks that nature is hard and slippery. At the time it accumulates, the water will seep-water collects in the rocks so as to make ground contact to be similar to the slippery clay. When the gravity of the soil mass is no longer tolerated by the frictional forces between the soil and rock layers of the soil then it will automatically slide. There was erosion of land.
Tie legs Has built in the district beyond these considerations? For high-alias width is not specifically tied his legs if need be assigned to secure areas of slip earlier. The first time I saw my tie is straight leg believes that these efforts will contribute to satisfy the no anticipation about the disaster. My belief is immediately evident on the spot. In another point of land landslide buried up to tie the legs and at other points developed a model that looks more like leg tie belt. Perhaps the intangible belt pile of stone cliffs were developed after the tie was unable to maintain the stability of the foot point. Even if there is a plan to raise the long-leg tie a headband belt until it is necessary to think over what exactly will be the area. Are all the hills will be transformed into bread covered with cement? The idea of ​​disaster mitigation as a result frustrations or limitations?

MAKE A polygon with COORDINATES ARE ALREADY SPECIFIED LIMIT


I was inspired office colleagues who have problems when having to make a polygon with the coordinates of box corners / edges of each polygon that has been determined. I was attracted to the rip off such problems and in less than 5 minutes, with the help of ArcGIS, I found a simple way. The way it departs from the logic that the computer or GIS software is actually always store the coordinates of each corner polygon description. If I can find how to open the attribute that contains the coordinates of the course there is a chance I can to reshape a polygon into a new polygon in accordance with the wishes. This desire is to create a polygon with a specified limit.
I simply just making arbitrary polygon. Then I turn on its editing feature. Then select the Task: Modify Feature (1). Polygons were raised vertex / point in each corner. In other words, these polygons have been ready to accept modifications.
The second step is to activate the Sketch Properties (2). Emerged a new window that displays tabular coordinates are recorded for each point on the polygon. This tabular value that is ready to be replaced (3). The last execution by Finish Sketch. Polygons have been "pulled" into the position we want. Very practical and simple. This step generates a polygon as generated COG

ILWIS pixel value IN SOFTWARE AND SOMETIMES NOT LIKE DIFFERENT EXPECTATIONS?

Often I get asked which is actually just the beginning of complaints from friends. They complain why the satellite imagery used to be represented by a value between 0-255 (8 bits) in the software ILWIS it represented a value outside that range. I then rushed him to see the domain system in its properties (right-click the file "Map" and select "Properties"). Please note the pull-down menu selected in the field "Domain". If the folder is opened a satellite image of the domain is generally required is "IMAGE".
There are a variety of domains to open various file formats on the ILWIS software. It should be noted here that the different domain with a domain that I cover in the post about the webblog / internet. To introduce or just to remind those who forgot, I wrote the following domains range in ILWIS (I quote from ILWIS Additional Help).

VALUE. Domain system is used generally to calculate.
DISTANCE. Domain system is designed to calculate the distance. Fair meter units used.
COUNT. Domain system is designed to calculate the value undefined.
MIN1TO1. Domain system is designed to calculate a value between -1.00 to +1.00.
NILTO1. Domain system is designed to calculate a value between 0.00 to +1.00.
PERC. Domain system is designed to calculate the percent.
BYTE. This domain system to calculate the image that has a value between 0 to 255 where 0 meant no undefined.
IMAGE. This domain system for image with integer values ​​between 0-255.
NOAA. This domain system to image with an integer value between 0-1023.
RADAR. This domain system for radar image that has an integer value between 0-32767.
BOOL. This domain system for calculating a boolean value: True, False, and undefined.
Yesno. This domain system for calculating a boolean value: Yes, No, and undefined.
BIT. Domain system is used to calculate a value between 0 and 1.
STRING. Domain system is used for the column that contains text such as descriptions.
UniqueID. Domain system is used to map where each mapping unit is expected to obtain a unique ID.
COLOR. Domain system is used for color images (256 × 256 × 256 colors).
COLORCMP. Domain system is used as an output color pengompositan operation.
FlowDirection. Domain system is used to calculate the eight cardinal directions. Domain output Flow direction is useful for operations on ILWIS.
NONE. Domain system is used for tables that do not have a class or ID domain.

I hope these quotes help!
* Author, Febrio Sapta Widyatmaka, S.Si
Often I get asked which is actually just the beginning of complaints from friends. They complain why the satellite imagery used to be represented by a value between 0-255 (8 bits) in the software ILWIS it represented a value outside that range. I then rushed him to see the domain system in its properties (right-click the file "Map" and select "Properties"). Please note the pull-down menu selected in the field "Domain". If the folder is opened a satellite image of the domain is generally required is "IMAGE".
There are a variety of domains to open various file formats on the ILWIS software. It should be noted here that the different domain with a domain that I cover in the post about the webblog / internet. To introduce or just to remind those who forgot, I wrote the following domains range in ILWIS (I quote from ILWIS Additional Help) .
1. VALUE. Domain system is used generally to mengkalkulasi.
2. DISTANCE. Domain system is designed to calculate the distance. A unit used meter.
3 fair. COUNT. Domain system is designed to calculate the value that is not terdefinisikan.
4. MIN1TO1. Domain system is designed to calculate a value between -1.00 to +1,00.
5. NILTO1. Domain system is designed to calculate a value between 0.00 to +1,00.
6. PERC. Domain system is designed to calculate the value persen.
7. BYTE. This domain system to calculate the image that has a value between 0 to 255 where 0
meant no terdefinisi.
8. IMAGE. This domain system for image with integer values ​​between 0-255.
9. NOAA. This domain system for image with integer values ​​between 0-1.023.
10. RADAR. This domain system for radar images that have integer values ​​between 0-32.767.
11. BOOL. This domain system for calculating a boolean value: True, False, and undefined.
12. Yesno. This domain system for calculating a boolean value: Yes, No, and undefined.
13. BIT. Domain system is used to calculate a value between 0 and 1.
14. STRING. Domain system is used for the column that contains text such as deskripsi.
15. UniqueID. Domain system is used to map where each unit is expected to obtain ID unik.
16 mapping. COLOR. Domain system is used for color images (256 × 256 × 256 colors) .
17. COLORCMP. Domain system is used as an operation output pengompositan warna.
18. FlowDirection. Domain system is used to calculate the eight cardinal directions. Domain output is useful for operations on ILWIS.
19 Flow direction. NONE. Domain system is used for tables that do not have a class or ID domain.