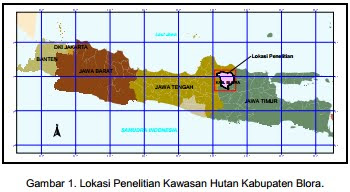
I. INTRODUCTIONUnderstanding of forests according to Law No.41 of 1999 is a unifiedform of landscape ecosystemsdominated by natural resourcestrees in their natural environment, the one with the othercan not be separated. Forests areThe main natural resources as oneone determinant of the life support system and source of prosperity of the people.1.1. BackgroundSpeaking about the potential of forests,Blora district as onedistricts that have the potential of forestslarge enough, vulnerable toillegal logging. In DistrictBlora itself during the period 1997to 2001 the lossesPerhutani increased alongincrease in timber theft (illegallogging). Due to the rampant lootingteak forest, the third loss in Blora KPH1997-2001 period increased, whichin 2001, loss of 414 704 trees valued at USD 165.9 billion. In addition tothat, due to looting of vacant landpotential as a critical area toFebruary 2002 an estimated 5600 acres(Reuters, February 7, 2003).Forest inventory activities is a forest resource assessment activities, including mappingand digital databases that describe the location and nature of parameters coverforests, including tree size, age,volume and species composition(Www.borealforest.org).Forest mapping using multitemporal remote sensing technology capable ofprovide data on forest area,forest density, and amendments thereto.While the Geographic Information Systemcan analyze the spatialaspects that affectdynamics of forest changes associatedwith some feature or other appearance in the earth's surface. The riseillegal logging in the District can Bloraassociated with some feature orcultural appearance on the surface of the earth,such as roads and settlements inenclave. The second appearance is closelyrelation to human activities, whichoften blamed as the main causeshrinking forest area in differentareas. Approach (analysis) spatio-temporal, it can be seenhow much change in the forestperiod 2001-2003 in the DistrictBlora appearance in relation to the three mentioned above. Analysisspatio-temporal analysis is a method of combination of spatial analysisand multiwaktu.1.2. PurposeThe purpose of this study was toknow the relation of forest changein the forest district Blorato the appearance of such culturalroads and residential usespatio-temporal analysis.1.3. Research SitesThis study took place inBlora district that has somePemangkuan Forest Region (KPK)with homogeneous dominant species of teak forests(Tectona grandis). Forestenter the administrative area of the DistrictBlora divided into permanent production forests,limited production forest, and nature reserves.II. METHODOLOGYThe method usedin this study is the image analysisLandsat ETM + satellite multiwaktu, analysisGeographic Information Systems (GIS), andfield surveys. Where a whole, these research methods are emphasizedspatiotemporal analysis methods.2.1. Tools and materialsTools and materials used inthis study are:
A set of computer and image processing software (ER Mapper 5.5) and Geographic Information Systems (Arc View 3.3); • Global Positioning System Receiver and compass; • Landsat ETM + digital image recording May 2001 and 2003, path / row 119/65; • Topographic maps of Indonesia (RBI) scale 1:25.000, Map scale Forest 1:100,000 and Map Blora District Administration. 2.2. Interpretation of Satellite Imagery A. Image pre-processing Before interpreting the images, the correction radiometric and geometric errors of the image needs to be done. base map used for geometric correction is a map of RBI. Once the corrected image, Sharpening-an then done to facilitate visual interpretation. 2. image interpretation To find out the forest coverage do visual image interpretation on site study. Class of land use used by Malingreau (1982). Image interpretation in 2001 and 2003 generates the data as presented in Table 1. 3. Field Survey Field survey aimed to verify the interpretation of land use, survey conducted in 2003. Data collection in 2001 through various sources and interviews. of results of field surveys, the accuracy can be tested image interpretation. For the image interpretation accuracy of 2001 amounted to 77.8%, while the year 2003 amounting to 82.2%. Calculation of test precision using the covariance matrix method (Short, 1982 in Sutanto, 1987). Table 1. Class and Area Land Use Interpretation Image Results (ha).


Example Calculation: ? Omission of Forest Land Use: (98/882) x 100% = 11.11% ? Forest Land Use Commission: (24/808) x 100% = 2.97% ? Overall accuracy of interpretation: ((784 + 492 + 484 + 124 + 346 + 440) / 3248) x 100% = 82.2% 2.3. Analysis of Geographic Information Systems (GIS) Using the overlay for know the land use changes that occurred in the forest district Blora. The results produced a map overlay area of land change forest. The next map change in land The back is overlaid with a buffer from the street and from the settlements in the enclave. Buffer distance itself varies, ie, 0-500 m and 500-1000 m. Query menu facilities assist in the tracking database attributes of the overlay to know the extent or location forests based on the appearance of cultural change and its buffer range. III. ANALYSIS AND DISCUSSION Based on land use change maps forest area of the overlay map use of forest land can be obtained land-use classes the change function. From Table 2 can observed the class and the broad land use are subject to change. Analysis of temporal changes in forest land generating a data field changes forest areas in the region administrative villages or districts. of Table 2, changes in forest land be the largest land use other is a moor, with an area of total of 10358.950 ha. utilizing the query


A set of computer and image processing software (ER Mapper 5.5) and Geographic Information Systems (Arc View 3.3); • Global Positioning System Receiver and compass; • Landsat ETM + digital image recording May 2001 and 2003, path / row 119/65; • Topographic maps of Indonesia (RBI) scale 1:25.000, Map scale Forest 1:100,000 and Map Blora District Administration. 2.2. Interpretation of Satellite Imagery A. Image pre-processing Before interpreting the images, the correction radiometric and geometric errors of the image needs to be done. base map used for geometric correction is a map of RBI. Once the corrected image, Sharpening-an then done to facilitate visual interpretation. 2. image interpretation To find out the forest coverage do visual image interpretation on site study. Class of land use used by Malingreau (1982). Image interpretation in 2001 and 2003 generates the data as presented in Table 1. 3. Field Survey Field survey aimed to verify the interpretation of land use, survey conducted in 2003. Data collection in 2001 through various sources and interviews. of results of field surveys, the accuracy can be tested image interpretation. For the image interpretation accuracy of 2001 amounted to 77.8%, while the year 2003 amounting to 82.2%. Calculation of test precision using the covariance matrix method (Short, 1982 in Sutanto, 1987). Table 1. Class and Area Land Use Interpretation Image Results (ha).
Example Calculation: ? Omission of Forest Land Use: (98/882) x 100% = 11.11% ? Forest Land Use Commission: (24/808) x 100% = 2.97% ? Overall accuracy of interpretation: ((784 + 492 + 484 + 124 + 346 + 440) / 3248) x 100% = 82.2% 2.3. Analysis of Geographic Information Systems (GIS) Using the overlay for know the land use changes that occurred in the forest district Blora. The results produced a map overlay area of land change forest. The next map change in land The back is overlaid with a buffer from the street and from the settlements in the enclave. Buffer distance itself varies, ie, 0-500 m and 500-1000 m. Query menu facilities assist in the tracking database attributes of the overlay to know the extent or location forests based on the appearance of cultural change and its buffer range. III. ANALYSIS AND DISCUSSION Based on land use change maps forest area of the overlay map use of forest land can be obtained land-use classes the change function. From Table 2 can observed the class and the broad land use are subject to change. Analysis of temporal changes in forest land generating a data field changes forest areas in the region administrative villages or districts. of Table 2, changes in forest land be the largest land use other is a moor, with an area of total of 10358.950 ha. utilizing the query